Long Live Flipper, All Hail The New Debugger

With the latest React Native release 0.73, one line in the release highlights particularly caught my eye:
We are gradually moving away from Flipper as the default tool for debugging React Native apps.
Now, that was unexpected. Despite Flipper occasionally being a thorn in our sides, it stood out as a convenient and potent tool for debugging. So I was surprised to learn that it was getting deprecated. Well if its getting deprecated what’s going to replace it? Let’s have a quick look at why React Native team decided to dethrone Flipper as the default debugging tool and what the team have in store as an alternative for the developers.
To give credit where it’s due, Flipper, at its best, functioned like a Swiss Army knife for developers — offering a log viewer, crash reporter, profiler, layout inspector, and much more under one roof. Its plugin architecture enabled developers to tailor the platform with custom debugging tools suited to their specific stack, positioning it as the one platform “to rule them all.” So, why did the React Native team decide to move away from Flipper?
What went wrong?
The Devil is in the details. Indeed, when Flipper faltered, it became a developer’s nightmare to rectify. Sometimes, fixing problems meant changing PodFiles. Other times, it involved editing Swift or Java files — tasks not for the faint-hearted. Compounding the frustration was how Flipper’s transitive dependencies with Android and iOS sometimes prevented apps from even starting up. The inclusion of Flipper in the build pipeline also led to increased build times for both Android and iOS apps. To add insult to injury, such issues often went unaddressed by the Flipper team for significant periods, leaving the developer community to fend for themselves.
This combination of technical hiccups and support gaps ultimately led to the React Native team’s decision to seek a more reliable and efficient debugging solution, sparking the transition away from Flipper.
What Changed?
The game-changer arrived with React Native 0.70, which shipped with Hermes as the default JavaScript Engine for both iOS and Android, taking over from JavaScriptCore (JSC).
Hermes is a lightweight JavaScript engine tailor-made for React Native, designed to offer faster startup times, a reduced memory footprint, and smaller app bundle sizes. The real icing on the cake is the seamless, out-of-the-box support for remote debugging via the DevTools Inspector Protocol.
Wondering how that benefits developers?
Previously, while using JSC, React Native facilitated debugging through an in-app proxy that allowed the application’s JavaScript code to run in Chrome. To put it simply, during debugging, the JavaScript code would run with in the browser’s V8 JavaScript engine rather than JSC on the device. It then communicated with the native thread via Web sockets.
Although this setup aided developers in debugging their JavaScript code, it had a crucial drawback: it didn’t utilise the same engine that runs the code in production. Consequently, any profiling done through the DevTools didn’t account for the limited hardware resources available on a mobile device.
Hermes revolutionised this process by adding native support for the remote debugging protocol. This change lets developers directly connect to the JavaScript Engine on the device. As a result, developers can debug natively, using the same JavaScript engine that runs in production. This approach leads to more precise CPU and memory profiles. It offers a debugging experience that more accurately reflects real-world performance conditions.
The Usurper
It’s time to meet our promised saviour!
Let’s quickly create a new ReactNative app based on version 0.73 and fire up the experimental debugger.
> npx react-native init RNTester
> cd RNTester
> npm start --experimental-debugger
Wait for the app to come up on Simulator and open debugger from the Dev menu and TADA! 🎉
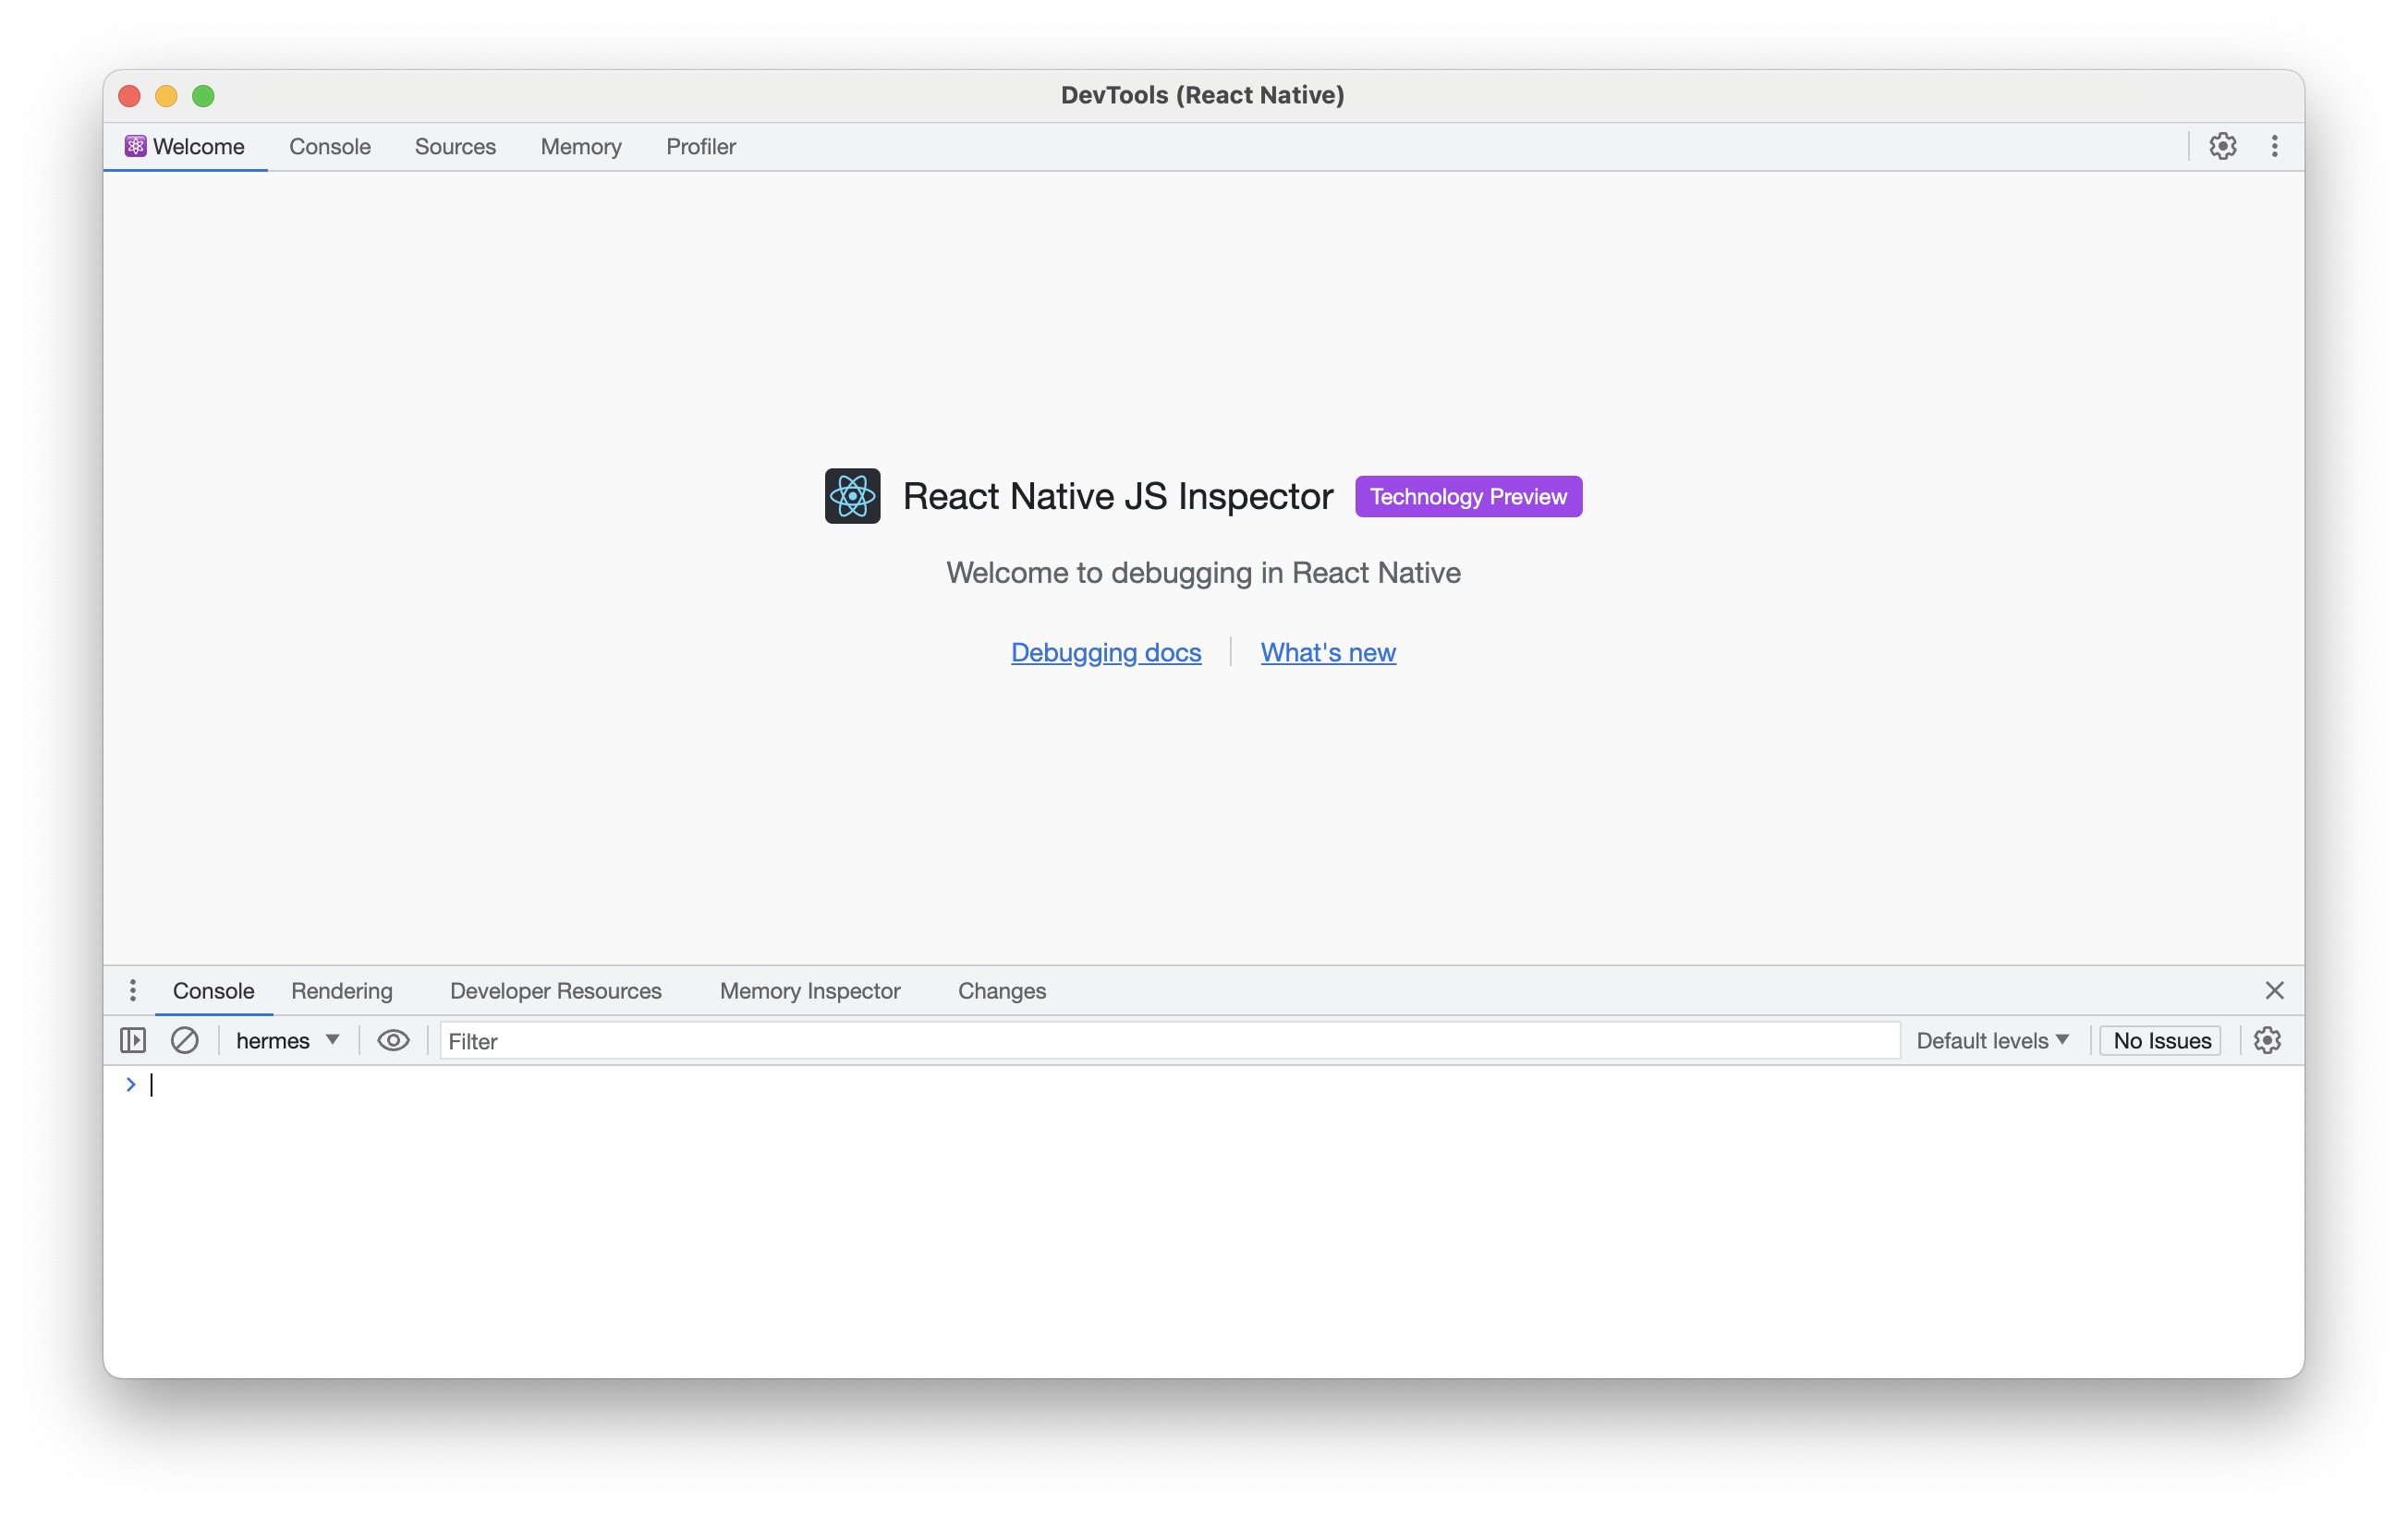
Hmm.. That one looks quite familiar. Isn’t it the same old Chrome developer tools? Well yes. The new debugger uses Google Chrome or Microsoft Edge DevTools to connect with the Hermes engine inside the app. So it is zero install unlike Flipper. It feels similar to debugging a web application.
However not all features are available at the onset. At the time of writing this article, only Console, Source, Memory & Profiler tabs are enabled. And there seems to be a bunch of “known issues (opens in a new tab)” that developers should be aware of. Now you understand why the team is rightly calling it the “Experimental Debugger” at this point.
Hermes gathers all console.log outputs from the app and adds them to the Dev Tools console when it's opened. This ensures you won't miss any actions, even when the debugger is not connected.
Future releases are expected to bring in the Network Panel, Assets panel and the all familiar React developer tools into the mix.
Contenders
The current shift in React Native’s debugging paradigm does more than just introduce a new tool; it broadens the horizon for several third-party debuggers to make their mark on the RN ecosystem.
Reactotron (opens in a new tab) is renowned for its user-friendly interface and comprehensive suite of features for inspecting and controlling your React Native applications. It’s particularly favoured for its straightforward setup and the ability to track network requests, and performance issues. It can also overlay images over the app, helping developers compare the layout with designs.
Expo Dev Tools (opens in a new tab) offers a web-based UI that complements the Expo CLI. It provides a convenient way to access logs, launch projects on different simulators, and publish updates. Its integration with the Expo ecosystem makes it a go-to for developers leveraging Expo for their RN apps.
Redux Dev Tools (opens in a new tab), though more specialised, is indispensable for developers working with Redux for state management. It allows for time-travel debugging, inspecting the state and actions, and even re-dispatching previous actions, offering a powerful insight into the application’s state over time.
Each of these tools has a “trick up its sleeve,” making them not just alternatives but enhancements to the React Native development experience. As React Native evolves, the variety and strength of these debugging tools create a strong ecosystem that meets many different development requirements and preferences.
Road Ahead
Understanding the shift away from Flipper as the default debugging tool for React Native is crucial. This transition doesn’t imply that Flipper will cease to be useful or relevant. On the contrary, Flipper will continue to exist as a standalone debugging tool. Developers who wish to use will have to manually configure it for their apps starting from v0.74.